Port Dashboards
Bromma is the leading manufacturer of spreaders — giant grip claws that sit on cranes lifting cargo containers all day long. Spreaders are about the size of a city bus, and contain quite a few moving parts. The environment is harsh — spreaders are often exposed to 11G — and sometimes they break down. This stops the entire port operation.
In order to come to terms with this, Bromma has been leading development of insights and smart maintenance.
I was the team lead and designer for this smart maintenance application used in ports all over the world.

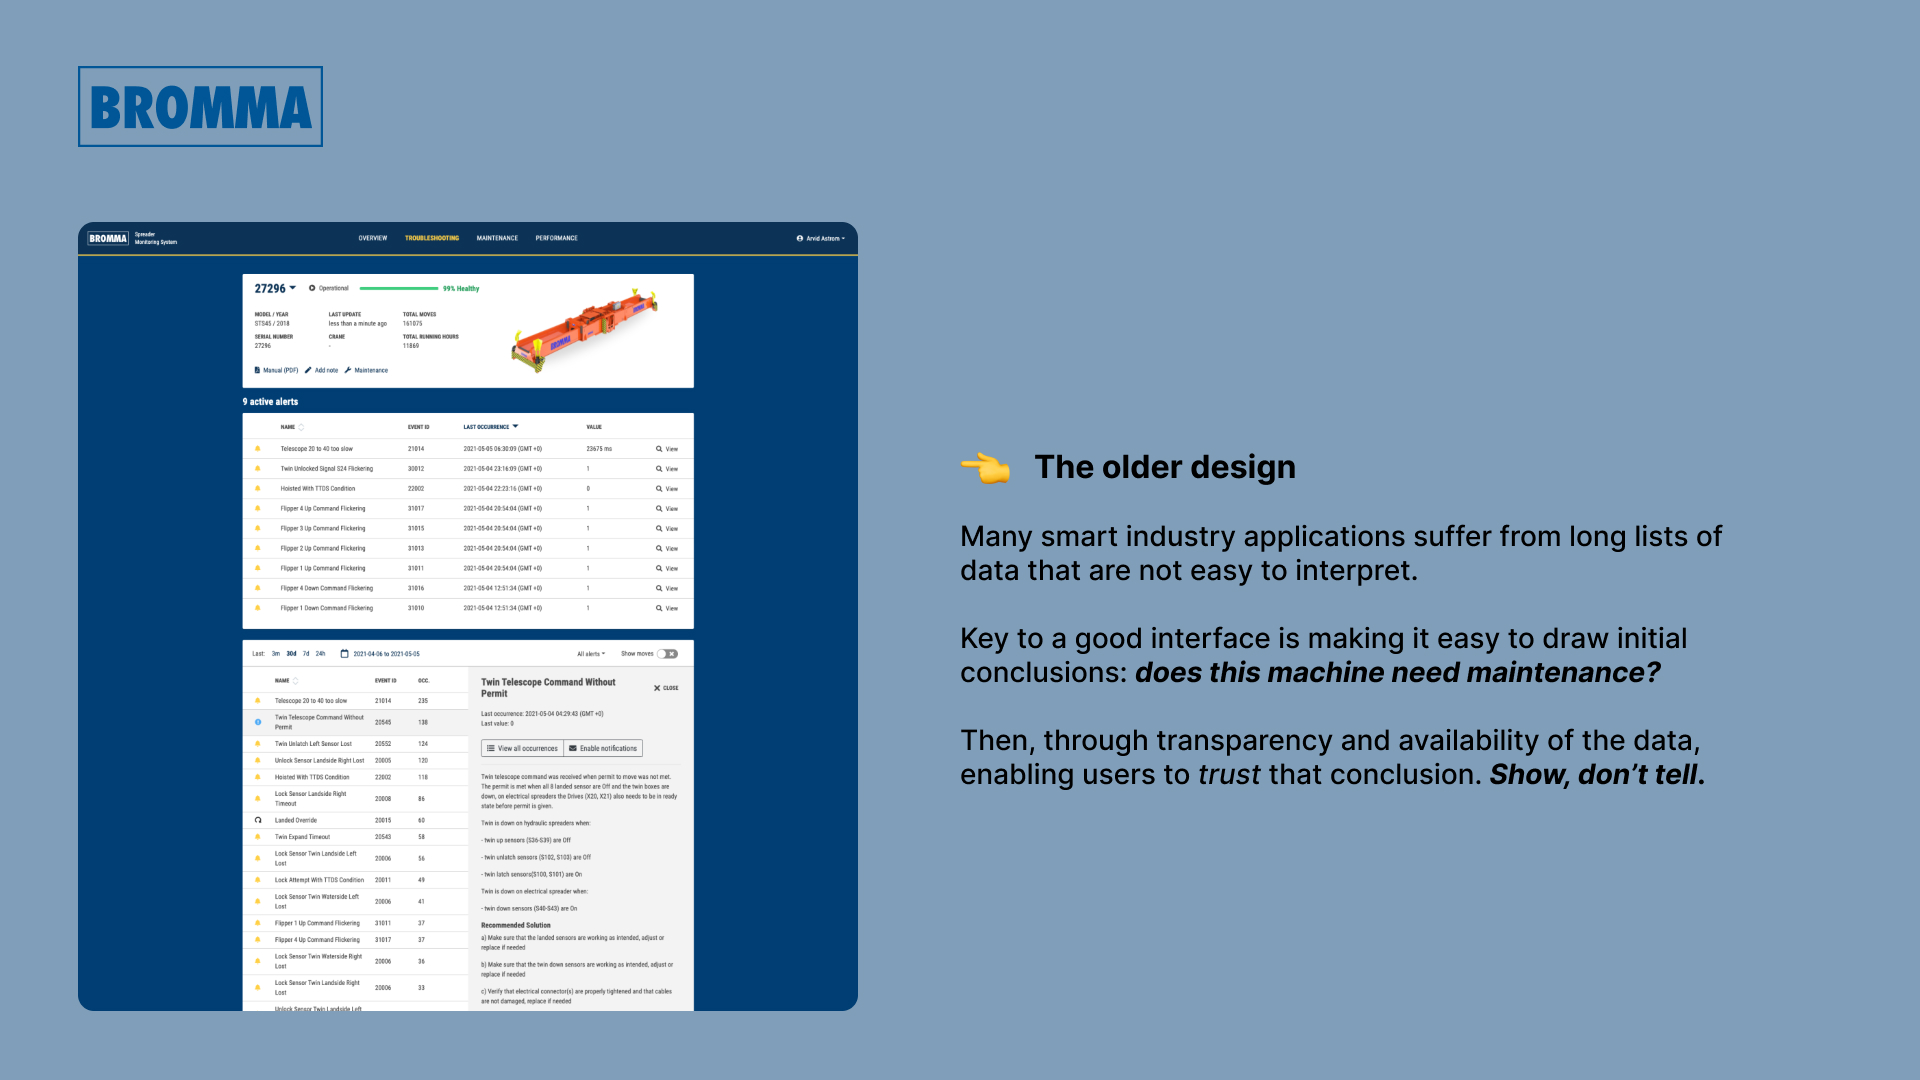
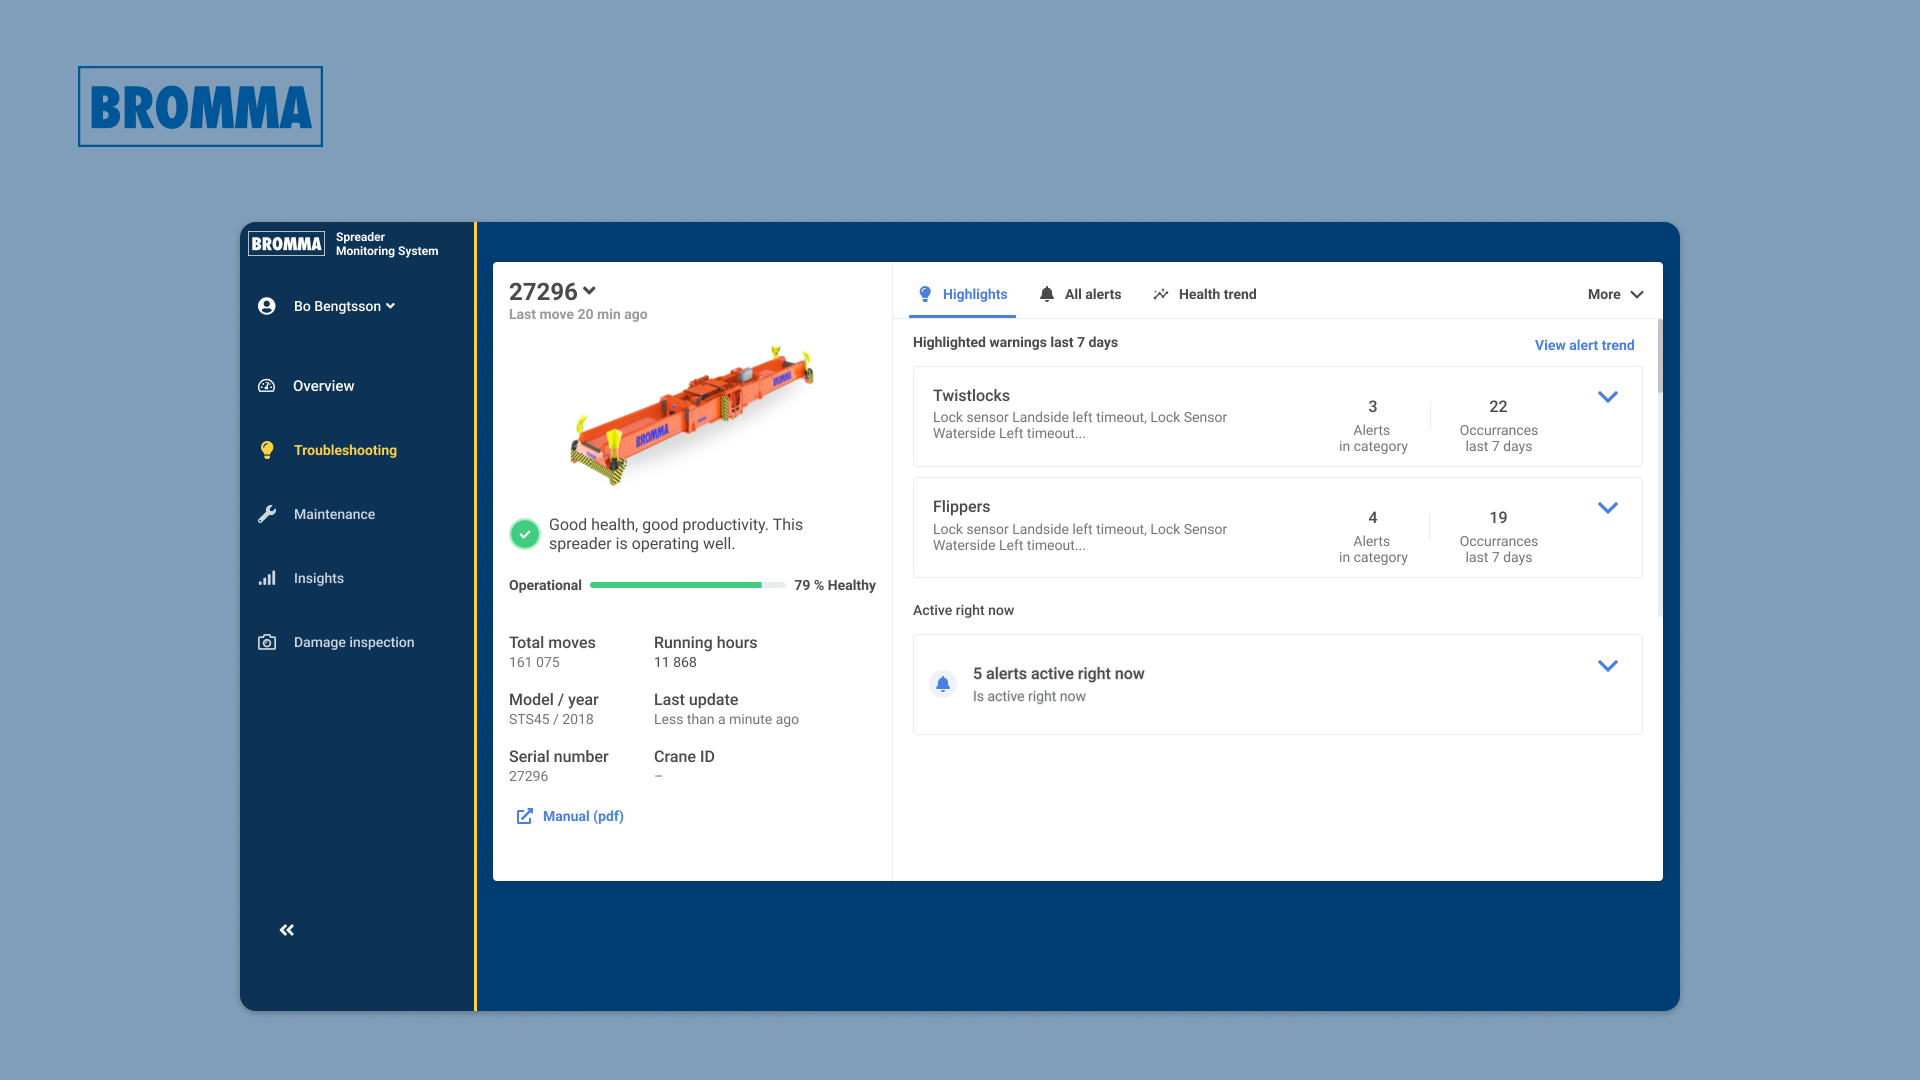
From I/O signals to actual understanding. The design challenge was to create meaning out of vast amounts of data. I/O-signals and error messages presented in an endless list doesn't help a port operator. Should he or she pause operations and switch the spreader for a fresh one? Or is it better to wait a bit longer? We developed a health score (kind of like for Pokémons), and added summarised highlights to prioritise and create meaning in the interface.
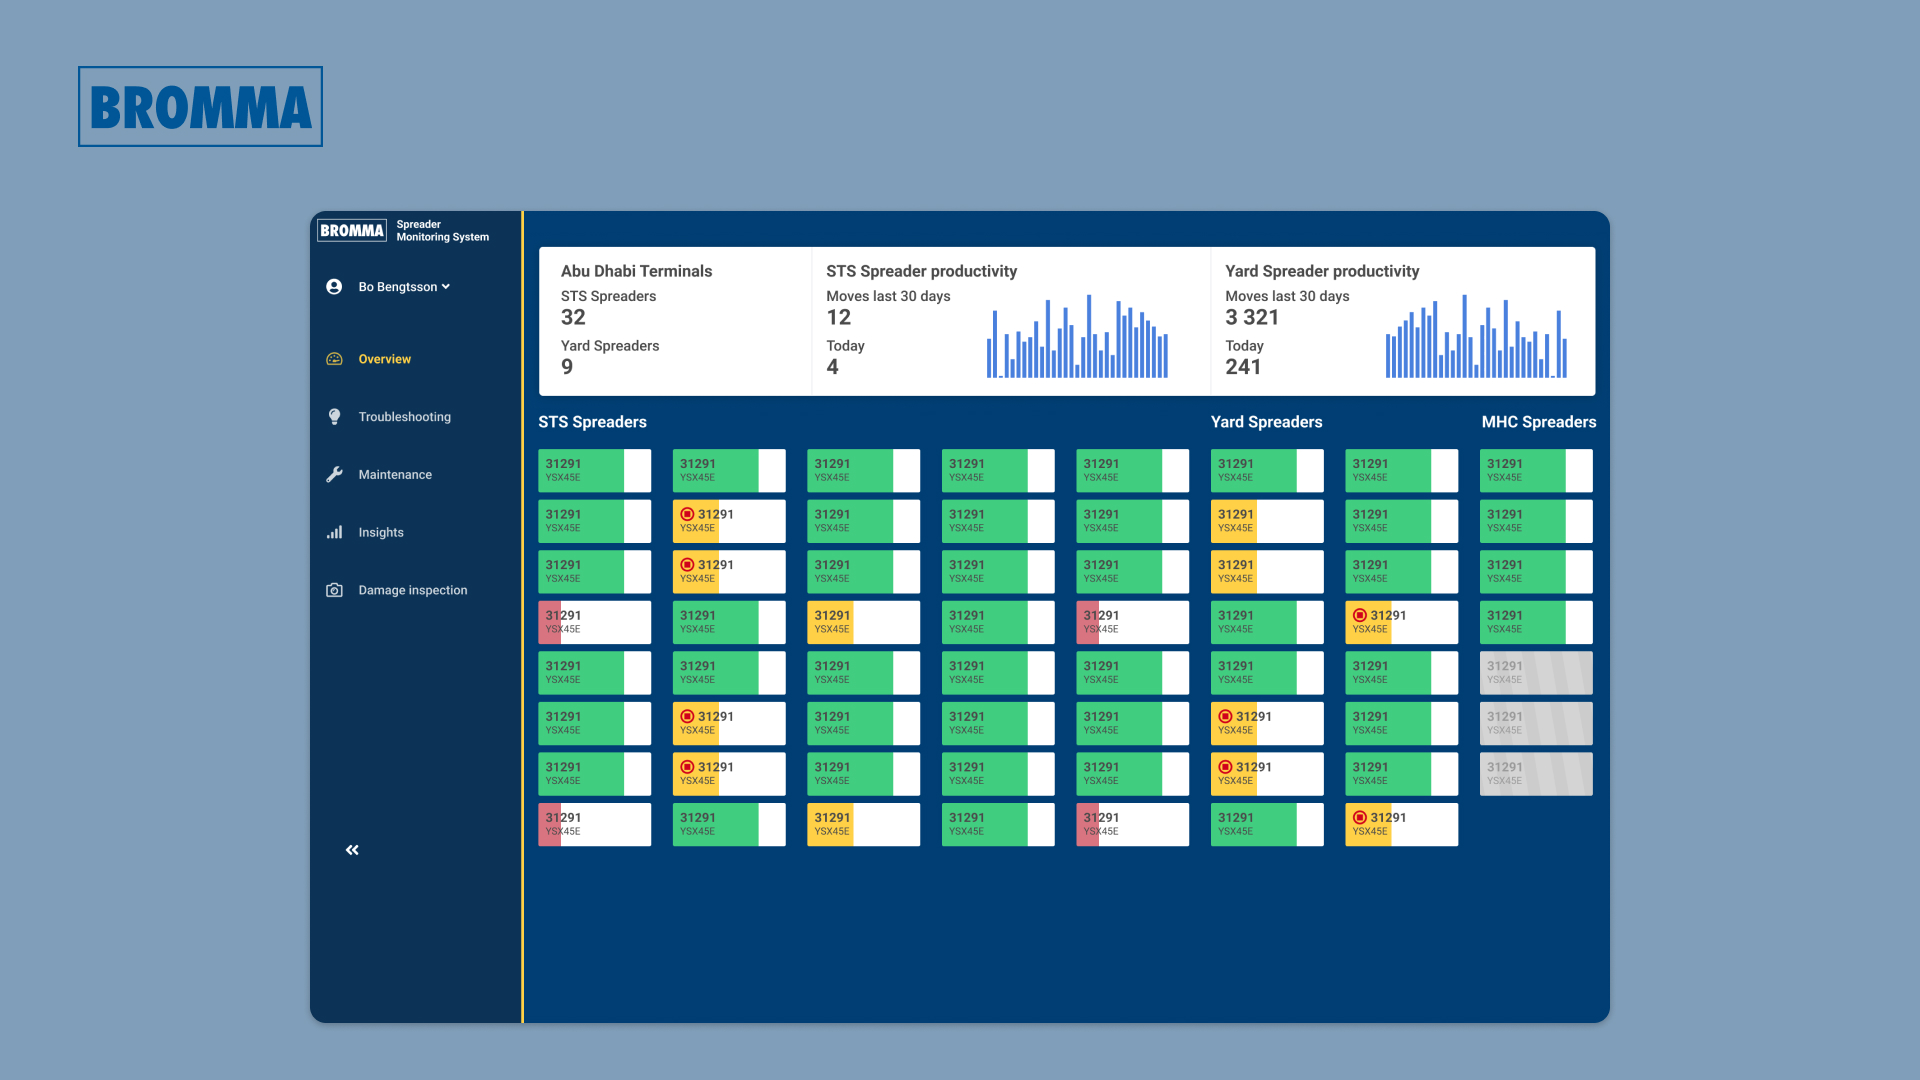
I wanted a user to be able to get overview instantly, while offering in-dept data without clicking around too much. Simply put, a good hierarchy.
Still transparency is important. No one trusts a "smart" application that just comes with a conclusion. Show don't tell is valid here more than ever, and the user should always be able to understand where the conclusion came from and see the raw data.


I redesigned the dashboard to work on desktop, mobile, and as a monitoring screen visible from afar in a control room.